Bernoulli's Equation
The Bernoulli equation states that,

Although these restrictions sound severe, the Bernoulli equation is very useful, partly because it is very simple to use and partly because it can give great insight into the balance between pressure, velocity and elevation.
How useful is Bernoulli's equation? How restrictive are the assumptions governing its use? Here we give some examples.
Pressure/velocity variation
Consider the steady, flow of a constant density fluid in a converging duct, without losses due to friction (figure 14). The flow therefore satisfies all the restrictions governing the use of Bernoulli's equation. Upstream and downstream of the contraction we make the one-dimensional assumption that the velocity is constant over the inlet and outlet areas and parallel.
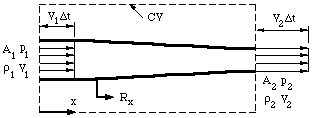 | Figure 14. One-dimensional duct showing control volume. |
When streamlines are parallel the pressure is constant across them, except for hydrostatic head differences (if the pressure was higher in the middle of the duct, for example, we would expect the streamlines to diverge, and vice versa). If we ignore gravity, then the pressures over the inlet and outlet areas are constant. Along a streamline on the centerline, the Bernoulli equation and the one-dimensional continuity equation give, respectively,
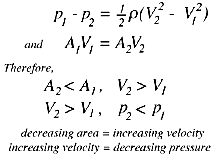
These two observations provide an intuitive guide for analyzing fluid flows, even when the flow is not one-dimensional. For example, when fluid passes over a solid body, the streamlines get closer together, the flow velocity increases, and the pressure decreases. Airfoils are designed so that the flow over the top surface is faster than over the bottom surface, and therefore the average pressure over the top surface is less than the average pressure over the bottom surface, and a resultant force due to this pressure difference is produced. This is the source of lift on an airfoil. Lift is defined as the force acting on an airfoil due to its motion, in a direction normal to the direction of motion. Likewise, drag on an airfoil is defined as the force acting on an airfoil due to its motion, along the direction of motion.
An easy demonstration of the lift produced by an airstream requires a piece of notebook paper and two books of about equal thickness. Place the books four to five inches apart, and cover the gap with the paper. When you blow through the passage made by the books and the paper, what do you see? Why?
Two more examples:
Example 1
A table tennis ball placed in a vertical air jet becomes suspended in the jet, and it is very stable to small perturbations in any direction. Push the ball down, and it springs back to its equilibrium position; push it sideways, and it rapidly returns to its original position in the center of the jet. In the vertical direction, the weight of the ball is balanced by a force due to pressure differences: the pressure over the rear half of the sphere is lower than over the front half because of losses that occur in the wake (large eddies form in the wake that dissipate a lot of flow energy). To understand the balance of forces in the horizontal direction, you need to know that the jet has its maximum velocity in the center, and the velocity of the jet decreases towards its edges. The ball position is stable because if the ball moves sideways, its outer side moves into a region of lower velocity and higher pressure, whereas its inner side moves closer to the center where the velocity is higher and the pressure is lower. The differences in pressure tend to move the ball back towards the center.Example 3
Suppose a ball is spinning clockwise as it travels through the air from left to right The forces acting on the spinning ball would be the same if it was placed in a stream of air moving from right to left, as shown in figure 15.
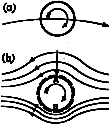 | Figure 15. Spinning ball in an airflow. |
A thin layer of air (a boundary layer) is forced to spin with the ball because of viscous friction. At A the motion due to spin is opposite to that of the air stream, and therefore near A there is a region of low velocity where the pressure is close to atmospheric. At B, the direction of motion of the boundary layer is the same as that of the external air stream, and since the velocities add, the pressure in this region is below atmospheric. The ball experiences a force acting from A to B, causing its path to curve. If the spin was counterclockwise, the path would have the opposite curvature. The appearance of a side force on a spinning sphere or cylinder is called the Magnus effect, and it well known to all participants in ball sports, especially baseball, cricket and tennis players.
Stagnation pressure and dynamic pressure
Bernoulli's equation leads to some interesting conclusions regarding the variation of pressure along a streamline. Consider a steady flow impinging on a perpendicular plate (figure 16).
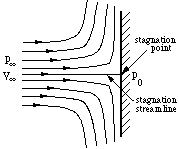 | Figure 16. Stagnation point flow. |
There is one streamline that divides the flow in half: above this streamline all the flow goes over the plate, and below this streamline all the flow goes under the plate. Along this dividing streamline, the fluid moves towards the plate. Since the flow cannot pass through the plate, the fluid must come to rest at the point where it meets the plate. In other words, it ``stagnates.'' The fluid along the dividing, or ``stagnation streamline'' slows down and eventually comes to rest without deflection at the stagnation point.
Bernoulli's equation along the stagnation streamline gives

where the point e is far upstream and point 0 is at the stagnation point. Since the velocity at the stagnation point is zero,

The stagnation or total pressure, p_0, is the pressure measured at the point where the fluid comes to rest. It is the highest pressure found anywhere in the flowfield, and it occurs at the stagnation point. It is the sum of the static pressure (p_0), and the dynamic pressure measured far upstream. It is called the dynamic pressure because it arises from the motion of the fluid.
The dynamic pressure is not really a pressure at all: it is simply a convenient name for the quantity (half the density times the velocity squared), which represents the decrease in the pressure due to the velocity of the fluid.
We can also express the pressure anywhere in the flow in the form of a non-dimensional pressure coefficient C_p, where

At the stagnation point C_p = 1, which is its maximum value. In the freestream, far from the plate, C_p = 0.
Pitot tube
One of the most immediate applications of Bernoulli's equation is in the measurement of velocity with a Pitot-tube. The Pitot tube (named after the French scientist Pitot) is one of the simplest and most useful instruments ever devised. It simply consists of a tube bent at right angles (figure 17).
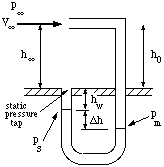 | Figure 17. Pitot tube in a wind tunnel. |
By pointing the tube directly upstream into the flow and measuring the difference between the pressure sensed by the Pitot tube and the pressure of the surrounding air flow, it can give a very accurate measure of the velocity. In fact, it is probably the most accurate method available for measuring flow velocity on a routine basis, and accuracies better than 1% are easily possible. Bernoulli's equation along the streamline that begins far upstream of the tube and comes to rest in the mouth of the Pitot tube shows the Pitot tube measures the stagnation pressure in the flow. Therefore, to find the velocity V_e, we need to know the density of air, and the pressure difference (p_0 - p_e). The density can be found from standard tables if the temperature and the pressure are known. The pressure difference is usually found indirectly by using a ``static pressure tapping'' located on the wall of the wind tunnel, or on the surface of the model.
Continuity Equation
When a fluid is in motion, it must move in such a way that mass is conserved. To see how mass conservation places restrictions on the velocity field, consider the steady flow of fluid through a duct (that is, the inlet and outlet flows do not vary with time). The inflow and outflow are one-dimensional, so that the velocity V and density \rho are constant over the area A (figure 14).
 | Figure 14. One-dimensional duct showing control volume. |
Now we apply the principle of mass conservation. Since there is no flow through the side walls of the duct, what mass comes in over A_1 goes out of A_2, (the flow is steady so that there is no mass accumulation). Over a short time interval \Delta t,
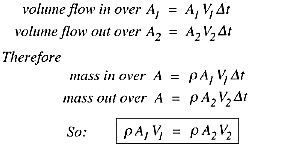
This is a statement of the principle of mass conservation for a steady, one-dimensional flow, with one inlet and one outlet. This equation is called the continuity equation for steady one-dimensional flow. For a steady flow through a control volume with many inlets and outlets, the net mass flow must be zero, where inflows are negative and outflows are positive.
Streamlines and Streamtubes
A streamline is a line that is tangential to the instantaneous velocity direction (velocity is a vector, and it has a magnitude and a direction). To visualize this in a flow, we could imagine the motion of a small marked element of fluid. For example, we could mark a drop of water with fluorescent dye and illuminate it using a laser so that it fluoresces. If we took a short exposure photograph as the drop moves according to the local velocity field (where the exposure needs to be short compared to the time it takes for the velocity to change appreciably), we would see a short streak, with a length V \Delta t, and with a direction tangential to the instantaneous velocity direction. If we mark many drops of water in this way, the streamlines in the flow will become visible. Since the velocity at any point in the flow has a single value (the flow cannot go in more than one direction at the same time), streamlines cannot cross. except at points where the velocity magnitude is zero, such as at a stagnation point.There are other ways to make the flow visible. For example, we can trace out the path followed by our fluorescent drop using a long-exposure photograph. This line is called a pathline, and it is similar to what you see when you take a long-exposure photograph of car lights on a freeway at night. It is possible for pathlines to cross, as you can imagine from the freeway analogy: as a car changes lanes, the pathline traced out by its lights might cross another pathline traced out by an adjoining vehicle at a different time.
Another way to visualize flow patterns is by streaklines. A streakline is the line traced out by all the particles that passed through a particular point at some earlier time. For instance, if we issued fluorescent dye continuously from a fixed point, the dye makes up a streakline as it passes downstream. To continue the freeway analogy, it is the line made up of the lights on all the vehicles that passed through the same toll booth. If they all follow the same path (a steady flow), a single line results, but if they follow different paths (unsteady flow), it is possible for the line to cross over itself. In unsteady flow, streamlines, pathlines and streaklines are all different, but in steady flow, streamlines, pathlines and streaklines are identical.